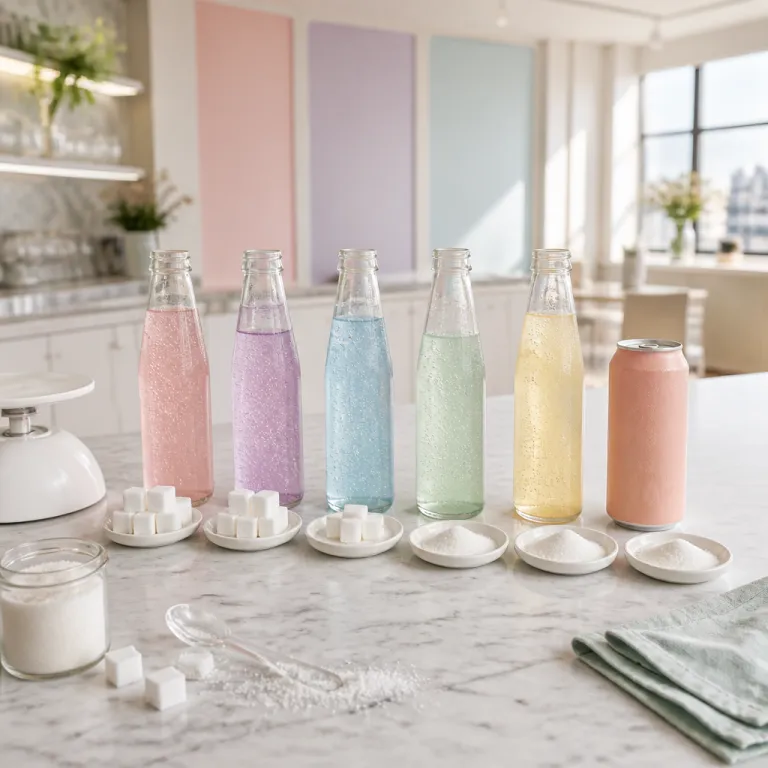
Why “what fizzy drink has the most sugar” is now a strategic beverage question
For modern hotel beverage programs, the question of what fizzy drink has the most sugar has moved from trivia to a boardroom KPI. When Directeurs F&B and chefs exécutifs evaluate drinks portfolios, they now weigh sugar exposure alongside margin, brand equity, and guest satisfaction, because sugary drinks directly influence guest health perception and long term loyalty. A beverage list that ignores sugar and sugars management risks higher operational costs, lower guest trust, and missed positioning in the healthy drinks and wellness oriented beverages segment.
Laboratory analysis from Queen Mary University of London (QMUL) on branded soft drinks in the UK identified Old Jamaica Ginger Beer as one of the highest sugar drinks on the market, with 52.8 grams of sugar per 330 millilitres, which is significantly more than a comparable can of Coca Cola at roughly 10.6g per 100ml. That work focused on products available at the time of sampling, so operators should always confirm current labels in case of reformulation. In that study, more than half of the ginger beers surveyed contained the equivalent of over 13 teaspoons of sugar per can. When you benchmark that single drink against the World Health Organization’s recommended free sugar intake of less than 10% of total energy (with a conditional target of 5%, around 25 grams per day for an adult of healthy body mass), one serving can exceed an adult’s guideline, which places this beverage in the high sugar and high calories risk zone for any hotel menu. For beverage directors, that data point reframes ginger beer from a simple mixer into a strategic sugar drink decision that affects menu engineering, staff training, and guest communication.
Every time people order soft drinks, soda pop, fruit juice, iced tea, or energy drinks in your outlets, they are making a health trade off they rarely see clearly. High sugar beverages contribute to weight gain, increased heart disease risk, and erosion of tooth enamel, which means your beverage program silently shapes long term guest outcomes. The more your équipe understands how each sugary drink, each artificially sweetened beverage, and each sparkling water or sugar free option fits into that health narrative, the more credible your brand becomes in the eyes of investors, regulators, and health conscious travellers.
From Old Jamaica Ginger Beer to coca cola: mapping high sugar risk in hotel beverage portfolios
When professionals ask what fizzy drink has the most sugar, they usually expect a mainstream soda, yet the data points elsewhere. In the Queen Mary University analysis of branded soft drinks, Old Jamaica Ginger Beer reached 52.8 grams of sugar per 330 millilitres, while a standard can of Coca Cola contained approximately 35 grams of sugar, which means the ginger beer carried roughly half again as many calories from sugars. For beverage strategists, that gap between one sugar drink and another is not academic; it is a concrete lever for repositioning cocktails, mocktails, and non alcoholic pairings.
In practice, a hotel bar that sells multiple ginger beer based long drinks in a single day may be serving more free sugar than from all its cola based soft drinks combined. That volume of sugary beverages accelerates weight gain trends among frequent guests and staff, and it also raises questions about heart health for corporate clients booking long residential meetings. When you map every soda, fruit juice, sweetened iced tea, and energy drinks SKU by grams of sugars per serving, you gain a portfolio view that supports both healthy drinks innovation and precise upselling of premium low sugar beverages.
High sugar soft drinks still have a place in many markets, especially where people associate full sugar with authenticity or value. Yet groups that lead the market now pair these sugar drinks with clear sugar free and artificially sweetened alternatives, plus unsweetened sparkling water, infused water, and freshly pressed juice options. For a deeper perspective on how a single product can anchor a high performing beverage program, the analysis of fortified wines in high performing hotel beverage programs built around Porto wine offers a useful parallel for thinking about sugar dense beverages.
Designing beverage programs that balance indulgence, calories, and health expectations
Once you understand what fizzy drink has the most sugar in your own inventory, the next step is to design a beverage architecture that balances indulgence and health. A credible program does not ban sugary drinks or sugar drinks; instead, it frames each drink within a clear ladder that runs from high sugar to sugar free and from high calories to low calories. This ladder helps people navigate choices between soda, sweetened drinks, fruit juice, sports drinks, artificially sweetened beverages, and genuinely healthy drinks such as unsweetened sparkling water or infused water.
For example, a lobby bar menu might cluster beverages into three zones labelled occasional treats, everyday choices, and performance hydration, each with its own mix of soft drinks, juice based cocktails, and sugar free or low sugar options. In the occasional treats zone, Old Jamaica Ginger Beer and full sugar coca cola can remain, but they are portion controlled and clearly flagged for sugars content and potential weight gain impact. In the everyday choices zone, you highlight sparkling water, lightly sweetened drinks, and reduced sugar iced tea, while the performance hydration zone focuses on water, low sugar sports drinks, and carefully formulated energy drinks that minimise free sugar.
Wine led programs face similar trade offs between pleasure and health, and the playbook used for red wine curation can inspire better non alcoholic design. The framework described for modern wine centric lists in leveraging accessible red wine in contemporary beverage programs can be adapted to soft beverages by segmenting by occasion, price, and perceived healthiness. When your équipe trains staff to speak fluently about sugars, tooth enamel protection, and heart friendly choices, the conversation around each drink becomes a value added service rather than a defensive health disclaimer.
Operational levers: menu engineering, portion control, and back of house systems
Understanding what fizzy drink has the most sugar is only useful when it translates into operational decisions that your équipe can execute consistently. Menu engineering is the first lever, where you reposition high sugar drinks like Old Jamaica Ginger Beer as premium mixers or occasional treats, while giving prime visual space to sugar free beverages, sparkling water, and healthy drinks. By adjusting glassware size, ice ratios, and default mixers, you can quietly reduce free sugar per drink without compromising perceived value.
Portion control is the second lever, especially in high volume outlets where people may order multiple sugary drinks in a single day without noticing. Switching from 330 millilitre cans to 200 millilitre serves for the highest sugar drinks, while maintaining price points through better garnish and presentation, can cut calories and sugars by a third or more. At the same time, offering carafes of chilled water or lightly flavoured water alongside soda pop and sweetened drinks nudges guests toward lower sugar drinking patterns that protect tooth enamel and support healthier weight trajectories.
Back of house systems close the loop by tracking beverage mix, drinks sugar volumes, and the ratio between sugar drinks and sugar free alternatives sold. When you integrate beverage data with kitchen analytics, you can align high sugar beverage promotions with food offers that are lighter in calories and fats, balancing the overall meal profile. In markets with soft drink industry levies, operators have reported double digit reductions in full sugar cola sales and a corresponding rise in low sugar SKUs once menus, training, and reporting were aligned, which underlines how structured monitoring can shift behaviour without sacrificing revenue.
Health, regulation, and brand positioning around sugary drinks in hospitality
As public health authorities sharpen their focus on what fizzy drink has the most sugar, hospitality brands find themselves under closer scrutiny. High sugar beverages are now linked in many national guidelines to increased risk of heart disease, type 2 diabetes, and dental erosion, which means every sugary drink on your list carries reputational implications. People increasingly expect hotels and resorts to act as responsible hosts who manage calories, sugars, and weight gain risks with the same care they apply to food safety.
Regulatory measures such as sugar taxes on soft drinks and mandatory labelling of free sugar content are reshaping the economics of soda, fruit juice, and energy drinks. In the UK, for example, the Soft Drinks Industry Levy has encouraged reformulation of many carbonated drinks below key sugar thresholds, while in several US cities local soda taxes have nudged consumption toward water and diet alternatives. In markets where these taxes apply, the gross margin on high sugar drinks may shrink, while sugar free and artificially sweetened beverages become more attractive from both a financial and health perspective. Forward looking groups are already renegotiating contracts with suppliers to secure better terms on sparkling water, low sugar iced tea, and reformulated sweetened drinks that protect tooth enamel and support healthy positioning.
Brand positioning now hinges on how transparently you communicate about sugar and how thoughtfully you curate beverage choices. A hotel that still pushes only full sugar coca cola, traditional soda pop, and syrup heavy juice based cocktails signals a dated understanding of guest expectations. By contrast, a property that offers clear information on grams of sugar per beverage, promotes water and healthy drinks as default options, and explains why certain sugar drinks like Old Jamaica Ginger Beer are framed as occasional indulgences, builds trust with both leisure guests and corporate wellness buyers.
Innovation opportunities: reengineering high sugar favourites without losing guest appeal
Knowing what fizzy drink has the most sugar in your bar gives your culinary and beverage équipe a starting point for innovation rather than a reason to delist products. Old Jamaica Ginger Beer, with its intense flavour and high sugar profile, can be reimagined in lower sugar formats by using it as a flavour concentrate rather than a base volume. By lengthening such a drink with sparkling water, flavoured water, or unsweetened iced tea, you can preserve the ginger character while cutting free sugar and calories per serve.
Mocktail development is another fertile ground, where chefs exécutifs and bar managers collaborate to replace part of the soda or fruit juice base with puréed whole fruit, herbal infusions, or cold brew tea. This approach reduces the proportion of sugar drinks in the glass and introduces fibre, aromatics, and complexity that appeal to people who usually avoid sugary drinks. Sports drinks and energy drinks can also be reformulated in partnership with suppliers to lower high sugar content, relying more on electrolytes, natural flavours, and modest levels of sugars that support performance without driving excessive weight gain.
Finally, training your équipe to speak confidently about sugar free and low sugar alternatives turns every interaction into a micro education moment. When a guest orders a soda pop or a full sugar drink, staff can suggest a half and half mix with sparkling water, or propose a sugar free version that still protects tooth enamel and aligns with heart health goals. Over time, these small shifts change the sales mix away from the highest sugar beverages while maintaining revenue, guest satisfaction, and the emotional comfort that many travellers still associate with a well made, slightly sweetened drink.
Key figures on sugar in fizzy drinks and hotel beverage programs
- Old Jamaica Ginger Beer has been measured at 52.8 grams of sugar per 330 millilitres in QMUL’s UK soft drinks survey, which means a single can can exceed an adult’s recommended free sugar intake for an entire day according to many public health guidelines.
- A standard 330 millilitre can of Coca Cola contains approximately 35 grams of sugar, so switching a guest from ginger beer to cola in one drink can reduce sugar intake by more than 30 percent for that serving.
- Replacing one daily serving of a high sugar soda with water, sparkling water, or a sugar free beverage can cut annual calorie intake by tens of thousands of calories, which translates into several kilograms of potential weight gain avoided over a year.
- Public health analyses consistently link frequent consumption of sugary drinks and soft drinks to higher incidence of heart disease and type 2 diabetes, which is why many national strategies now target free sugar reduction in beverages as a priority lever.
- Studies on dental health show that repeated exposure of tooth enamel to sugar and acidic beverages such as soda, energy drinks, and fruit juice significantly increases the risk of erosion, especially when people sip these drinks throughout the day instead of limiting them to mealtimes.
| Beverage | Sugar (g) per 100ml | Sugar (g) per 330ml can |
|---|---|---|
| Old Jamaica Ginger Beer | ≈16.0 | 52.8 |
| Coca Cola (regular) | ≈10.6 | ≈35 |
| Typical orange soda | ≈11.0 | ≈36 |
| Standard lemonade (carbonated) | ≈9.0 | ≈30 |
| Diet or zero sugar cola | <0.5 | <2 |
FAQ: sugar, fizzy drinks, and hotel beverage strategy
Which fizzy drink has the most sugar?
Which fizzy drink has the most sugar? Old Jamaica Ginger Beer contains 52.8g of sugar per 330ml can in the Queen Mary University of London analysis of UK soft drinks. In a hotel context, that makes it one of the most sugar dense beverages on a typical bar list, and it should therefore be treated as an occasional indulgence rather than an everyday refreshment.
How much sugar is in a can of Coca Cola?
How much sugar is in a can of Coca-Cola? A 330ml can of Coca-Cola contains approximately 35g of sugar, or about 10.6g per 100ml. Beverage directors can use this figure as a benchmark when comparing other soft drinks, fruit juice blends, and sweetened drinks in their portfolios.
Are there fizzy drinks with low sugar content?
Are there fizzy drinks with low sugar content? Yes, many brands offer low-sugar or sugar-free alternatives. For hospitality operators, listing these alongside traditional soda pop and sugar drinks, and training staff to highlight them, is essential for meeting growing demand for healthy drinks.
How should hotels communicate about sugary drinks to guests?
Hotels should present clear information on grams of sugar, calories, and whether a beverage is sugar free, low sugar, or high sugar, ideally on menus and digital ordering platforms. Staff should be trained to explain the impact of sugary drinks on weight gain, heart health, and tooth enamel in simple, non judgmental language. This transparency builds trust and helps people make informed choices without feeling lectured.
What practical steps can reduce sugar from beverages without hurting revenue?
Operators can reduce portion sizes for the highest sugar drinks, promote sparkling water and sugar free beverages as default mixers, and reengineer cocktails to use less soda and fruit juice while adding herbs, bitters, and unsweetened infusions. Monitoring sales data allows teams to track shifts from sugar drinks to healthier beverages and to adjust pricing and promotions to protect margins. Over time, a balanced mix of indulgent and healthy drinks can support both guest satisfaction and long term profitability.
References
- Queen Mary University of London – Laboratory analysis of sugar content in soft drinks and ginger beers sold in the UK, including Old Jamaica Ginger Beer at 52.8g sugar per 330ml at the time of sampling.
- World Health Organization – Guidelines on free sugar intake and non communicable disease risk, recommending less than 10% of total energy from free sugars, with a conditional target of 5% (around 25g per day for many adults).
- Public Health England – Evidence reviews on sugary drinks, obesity, and dental health, and evaluations of sugar reduction and soft drinks industry levy impacts.